Price History
App Description
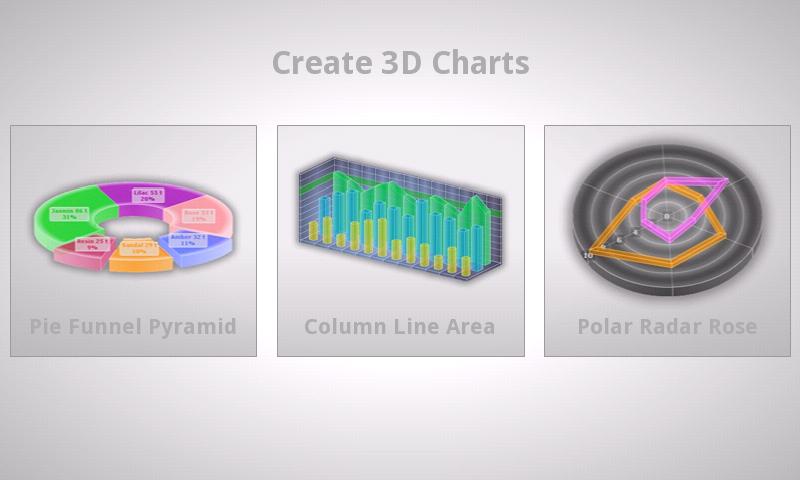
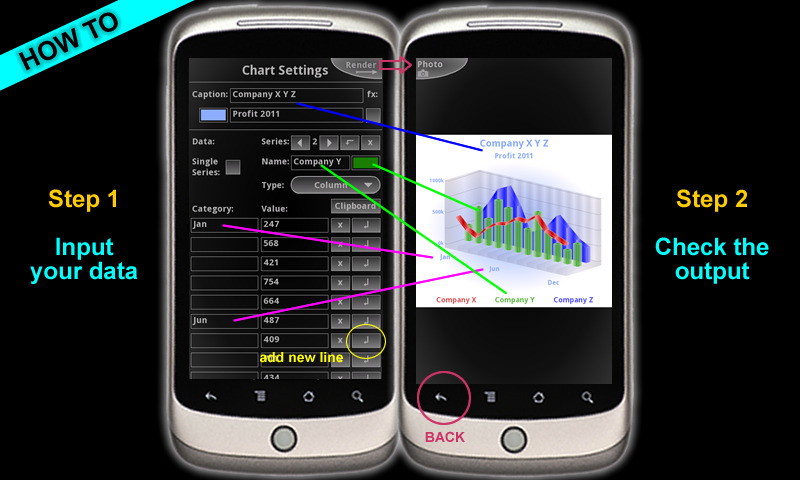
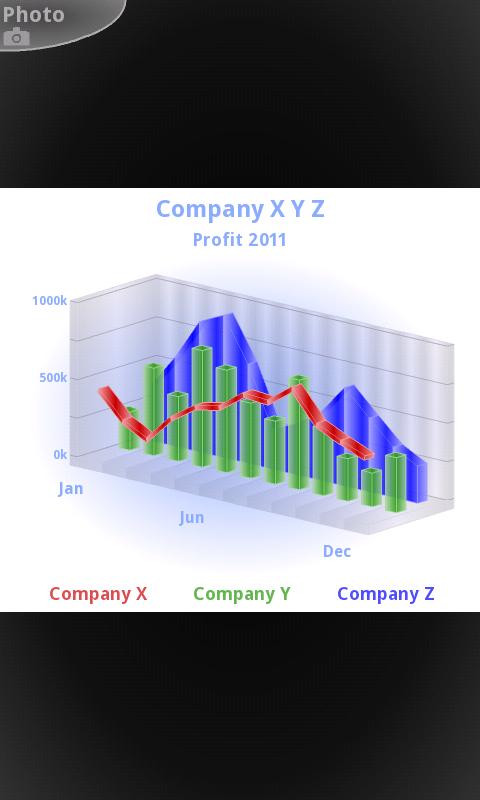
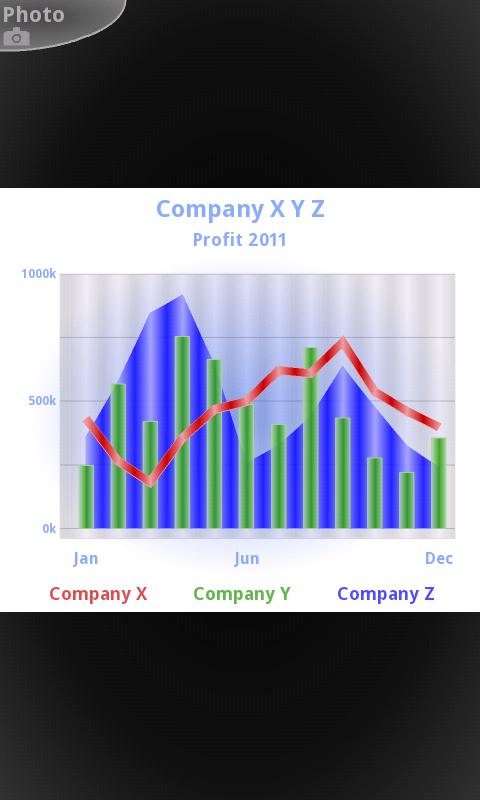
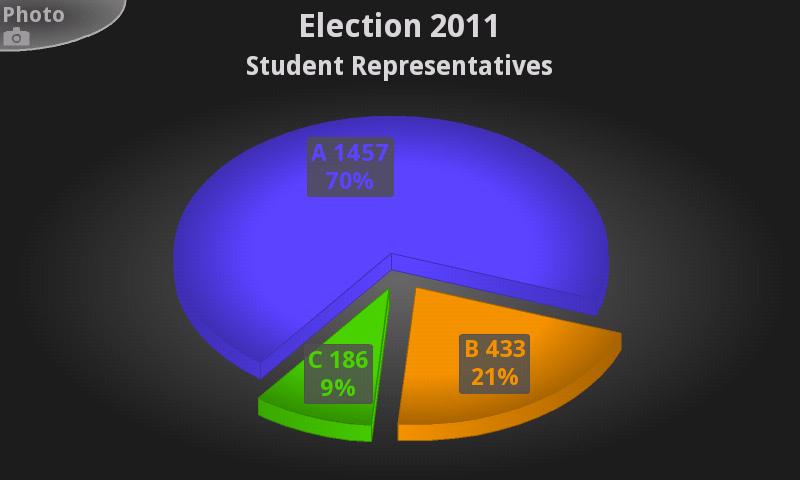
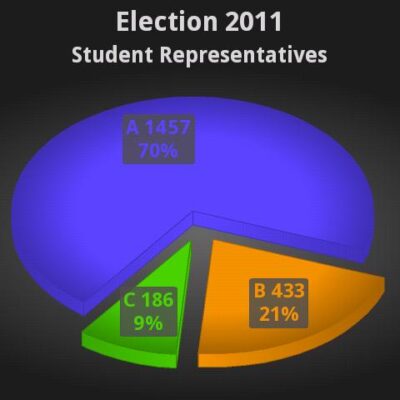
All charts are highly customizable, set your own colors to load pictures and logos as background, and save the graph as an image rendered in 3D to Android’s photo gallery. Export your charts as a high-quality PNG file with transparency (good for graphic designers). Use your own chart photos as attachment or upload. It’s great for mobile blogging and for social sites … boost your data analysis.
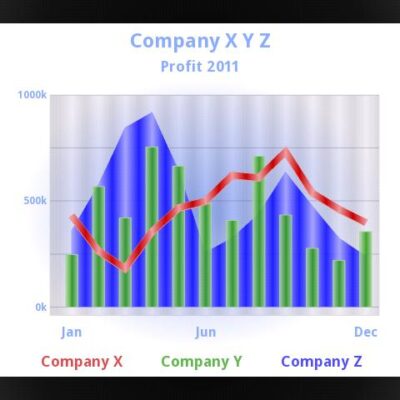
This app is the enhancement for your mobile office and journalism and press reporting on the move. It’s loaded with features for science development and research. Also, it’s beloved for monitoring blood pressure over time recording body weight, mileage and electricity consumption … the isometric 3D projection makes data comparison easy and yet it’s very eye-catching. 3D Charts is an essential tool you don’t want to miss.
Set number prefixes like ‘$ € £ ¥’ or a suffix like ‘t’ for tonnes. UTF-8 font support. So type Chinese Korean Arabic Hebrew if you like. ÇÖéØ
Scaling (official SI abbreviations) font-size bold number precision can be set. 3D-2D aspect ratio and width / height slider. Just remember your mobile device features a high-resolution DPI dots per inch screen compared to a desktop monitor. This means Chart images will look way bigger on PCs in size.
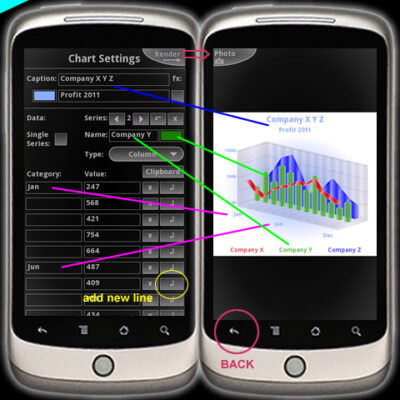
Yes, the data can be exported to Android’s clipboard, copy, and paste. All data is automatically saved. ‘Save As’ project option.

Doug Lynch
Hi! You may have seen my work at other Android publications including XDA and Phandroid, but I have branched out on my own to create content for the community. Most of my work consists of finding the best deals in the Google Play Store, creating tutorials on my YouTube channel, and curating the best applications and games on Play Store Finder.
Also On Sale
-
G30 – A Memory Maze
$3.99 -
Net Signal Pro
$0.49 -
Who Uses My WiFi
$0.49
